Data Science and A.I. – Measures of Dispersion: Variance of Discrete Frequency Distribution
In this post from PostNetwork Academy’s Data Science and A.I. Lecture Series, Bindeshwar Singh Kushwaha walks us through the process of calculating the variance of a discrete frequency distribution. This is an essential statistical measure for understanding the spread of data points in a dataset.
Calculating the variance of a discrete frequency distribution
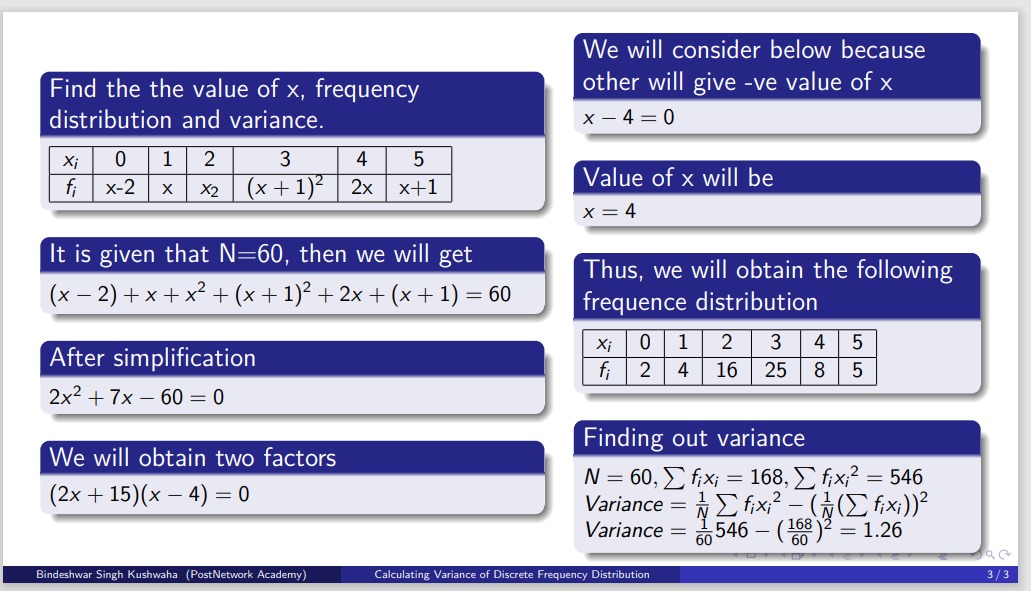
He explains that we will be solving for \( x \) and discusses the frequency distribution with values ranging from 0 to 5.
Given that \( N = 60 \), we calculate the sum of the frequencies and simplify the resulting equation. After simplification, we get the quadratic equation \( 2x^2 + 7x – 60 = 0 \), which is solved to find \( x = 4 \).
With \( x = 4 \), we update the frequency distribution table and calculate the necessary values. The sums are:
– \( N = 60 \)
– \( \sum f_i x_i = 168 \)
– \( \sum f_i x_i^2 = 546 \)
Plugging these values into the variance formula, we obtain a variance of 1.26.
Video
Document
Data Science and A.I. – Measures of Dispersion: Variance of Discrete Frequency DistributionKey Takeaways:
-Solving for \( x \): After calculating the value of \( x \), it is substituted into the frequency distribution table.
-Variance Calculation: Using the standard formula for variance, we calculate the spread of the data.