Hello everyone! Welcome back to Postnetwork Academy. I’m Bindeshwar Singh, and today we’re going to uncover a key concept in statistics that helps you understand data more deeply—deciles!
Have you ever wondered how to break down a data set into smaller, meaningful parts? Deciles allow us to split data into 10 equal sections, giving us a clearer view of its distribution. In this post, we’ll dive into a practical example, learning how to find the 3rd and 7th deciles in an easy, step-by-step way.
Deciles Calculation and Visualization
Author: Bindeshwar
Date: 4/1/2025
1. Given Data Set and Decile Calculation
Given data set: 3, 6, 9, ... , 60
To find the 3rd and 7th deciles, we use the position formula:
where n = 20.
2. 3rd Decile Calculation
The position of
The 3rd decile,
3. 7th Decile Calculation
The position of
The 7th decile,
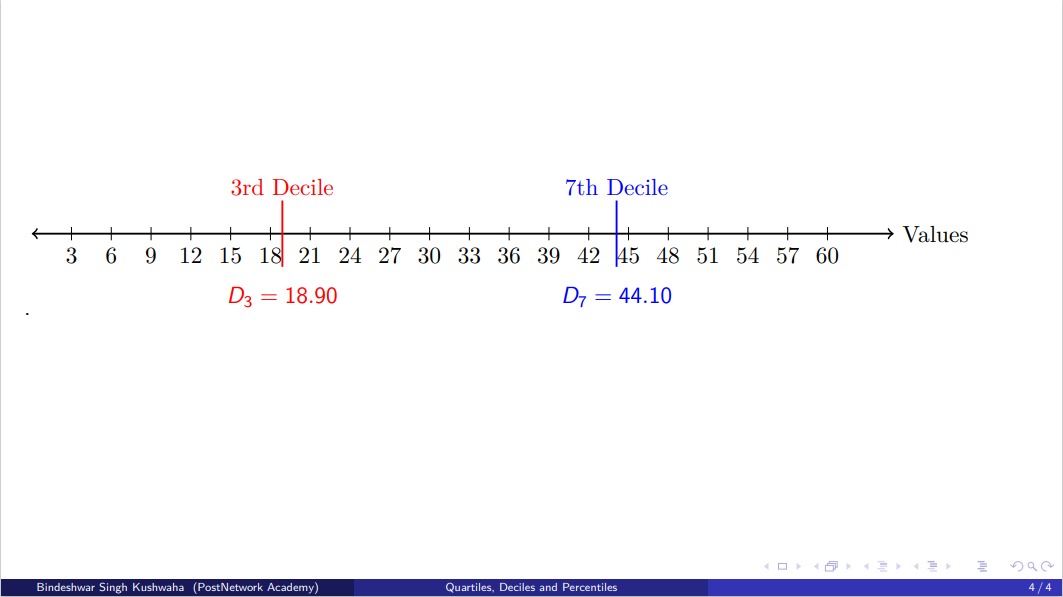
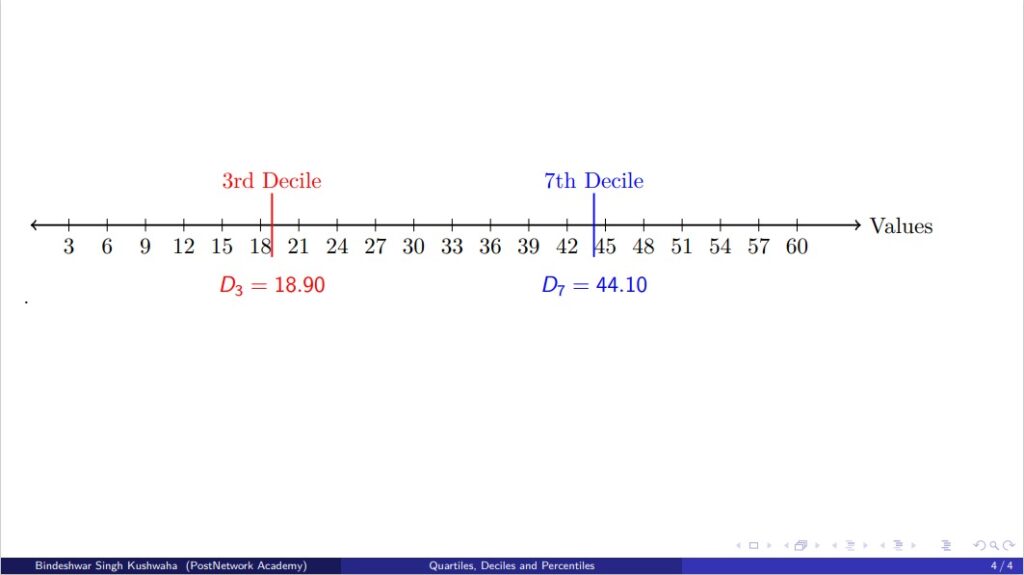
4. Results
We conclude that:
- 3rd Decile (
- 7th Decile (
5. Visualization of Data Set with Deciles
Below is a representation of the number line with the positions of